Abstract
In this work we introduce Phylograph; a multifunctional tree editor particularly indicated for large trees. The application reads trees up to 1000-1200 leaves and constructs and edits graph drawings in different layouts. Phylograph roots the tree using as outgroup a single leave or a whole branch, simply via the computer mouse. The tool incorporates a wide set of functions to expand, compress, invert, and/or rotate a tree. Phylograph allows the cutting of branches and the incorporation of decorations such as tags, brackets, boxes, and arrows. The tool also allows the user to save the tree drawing as a re-editable project and offers the choice of various exportable image formats, including a HTML format suited to databases. Phylograph is a Java application. This means that the tool runs on personal computers as a standalone program. We also present here an overview of the algorithms used by Phylograph to represent the tree drawings.
Availability
Available online February 1, 2008. Phylograph is distributed under the terms of the Biotechvana Private Source License (URL 1).
Introduction
Phylogenetic analyses reconstruct the evolutionary history of biological species, genes, and proteins based on similarity scoring. A phylogenetic tree usually represents the evolutionary distances among the Operative taxonomical Units (OTUs), which are represented by leaves. Phylogenetic analyses usually save the outputs in two of the most commonly accepted formats - nexus (1) or newick (URL 2) ? To phylogenetically interpret a tree users graphically represent it as a branching graph, where each node with descendants represents the most recent common ancestor of the descendants, and edge lengths correspond to time or distance estimates. This is, Phylogenetic trees constitute a particular case of graph theory (2) where OTUs are called leaves and branches not representing leaves are called nodes. Children of the same parent are called siblings. According to graph theory, a tree T (V,E) is an abstract structure used to describe a limited set of nodes or vertices (V) connected by edges (E) or segments not allowed to overcross. The graph drawing is the spatial or graphical representation of the graph. The tree is transformed by "divide and conquer" principles, from an abstract representation T (V,E) into an arrangement of geometric objects (subtrees) enclosed in a multi-dimensional space called the drawing space. A tree T (V,E,d) usually incorporates information regarding the length (δ) or extent of an edge as an additional variable defined by the genetic or protein distance between two nodes. In the case of majority-rule consensus trees (MRC) trees (3) this variable is defined by the numbers that correspond to consensus values defined by all groups occurring more than a certain percentage level. There are essentially two types of phylogenetic trees, rooted and unrooted (4). Rooted trees are "n-ary" trees where there is a specially designated node (the root) that is the common ancestor for the remaining nodes in a hierarchy of parents and children (a tree is "n-ary" if every internal node has no more than "n" children). Nodes are partitioned into subtrees where the level of a node is defined by letting the root at level zero. Note therefore that a node at level "l" has children at level ("l"+1). The number of subtrees of each node is called its degree, and the maximum degree of all nodes is called the degree of the tree. The degree of a node (a subtree) is usually defined by letting the OTUs at degree zero. Unrooted trees represent the branching order, but do not indicate the root or location of the last common ancestor. With the recent explosion in the amount of genomic data available, and exponential increases in computing power, biologists are currently able to consider larger scale problems in phylogeny. That supposes the construction of evolutionary trees on hundreds or thousands of taxa. When working with trees containing more than 50 OTUs some graphical problems arise in the interpretation of large trees; leaves overlap and font sizes are usually too small to be easily read. Consequently, trees must be magnified or expanded to be clearly interpreted. Graphical representations of phylogenetic trees usually need certain modifications and decorations that require the use of additional image editors. With the aim to obtain an editor capable of handle, edit, and decorate all kinds of phylogenetic trees we have designed Phylograph.
Overview
System
Phylograph is a Java application. This means that the tool runs on personal computers (PCs) and workstations as a standalone program. The Model View Controller "MVC"; a programming pattern to maintain the independence and visualization of data was used to divide the application into three layers - Model, View and Controller-.
The model layer contains the program's logic and executable functions. The view layer defines the graphical user's interface and presents all visual elements in a main window (buttons, lists, text-fields, etc). The controller layer provides the connection between the other two layers.
Functions
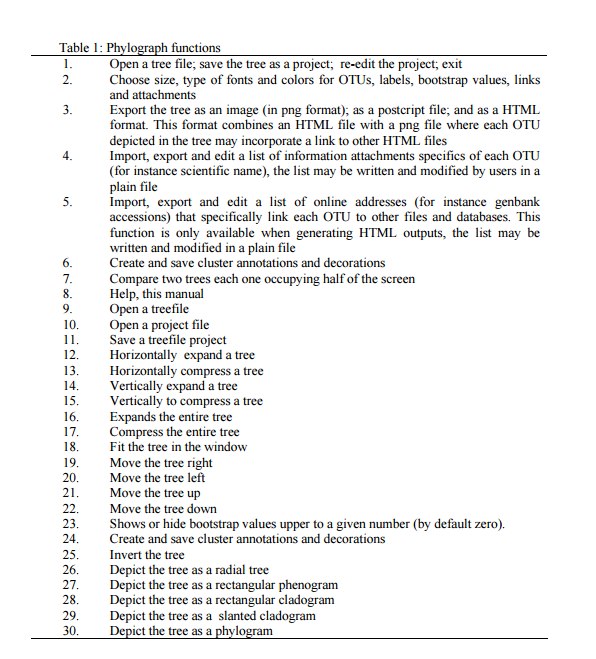
As shown in Figure 1, Phylograph allows user to manage tree description up to 1000-1200 leaves via a control panel that incorporates a wide set of options summarized in Table 1. Through the computer mouse, users can rotate and root the tree using as outgroup a single leave or a whole branch. The tool allows users to hide branches, generate subtrees, change the colors of branches and OTUs, etc. Users can also use Phylograph to decorate the tree with dynamic labels and brackets that may be dragged or resized (see the Section below, "Empirical example"). All implementations can be saved as a project to improve or modify the decoration and/or information background of the tree.
Methodology
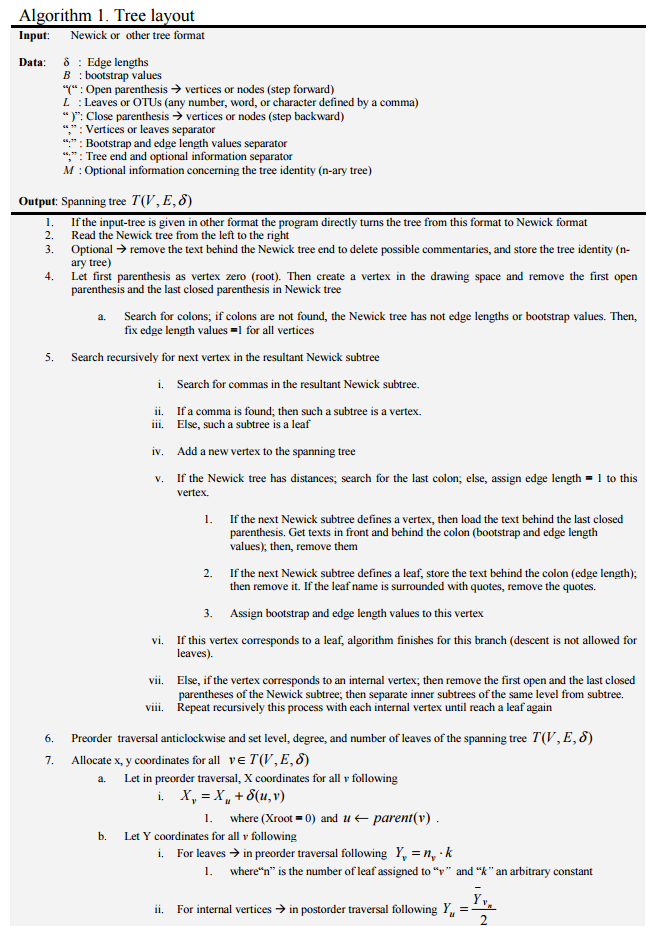
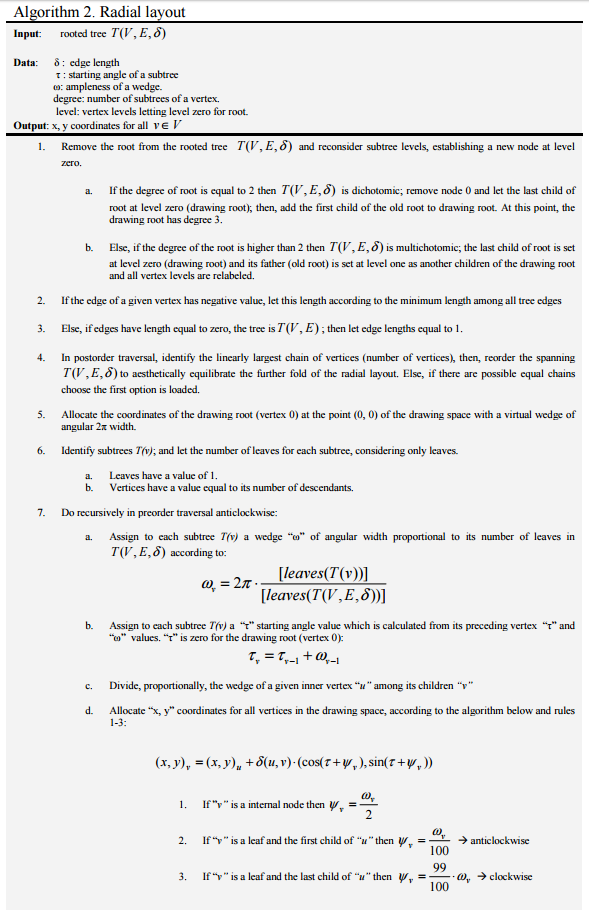
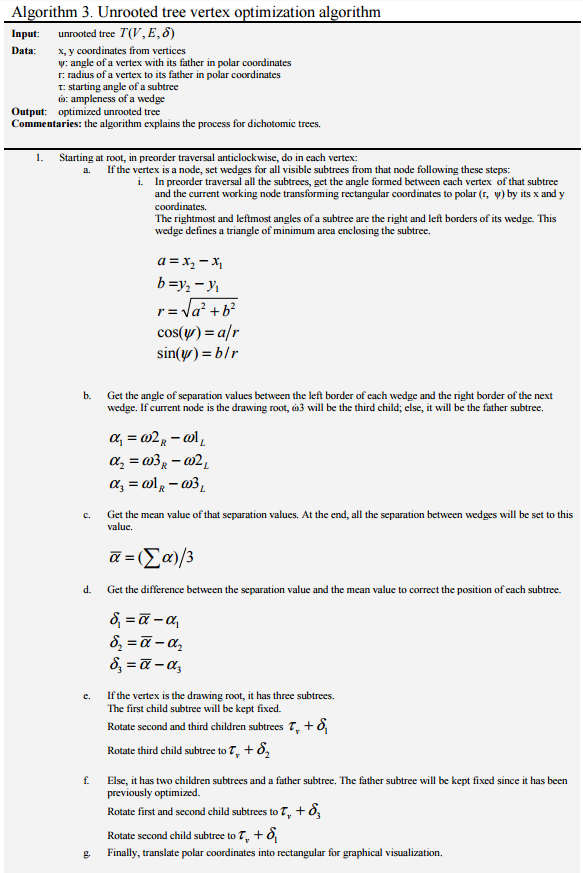
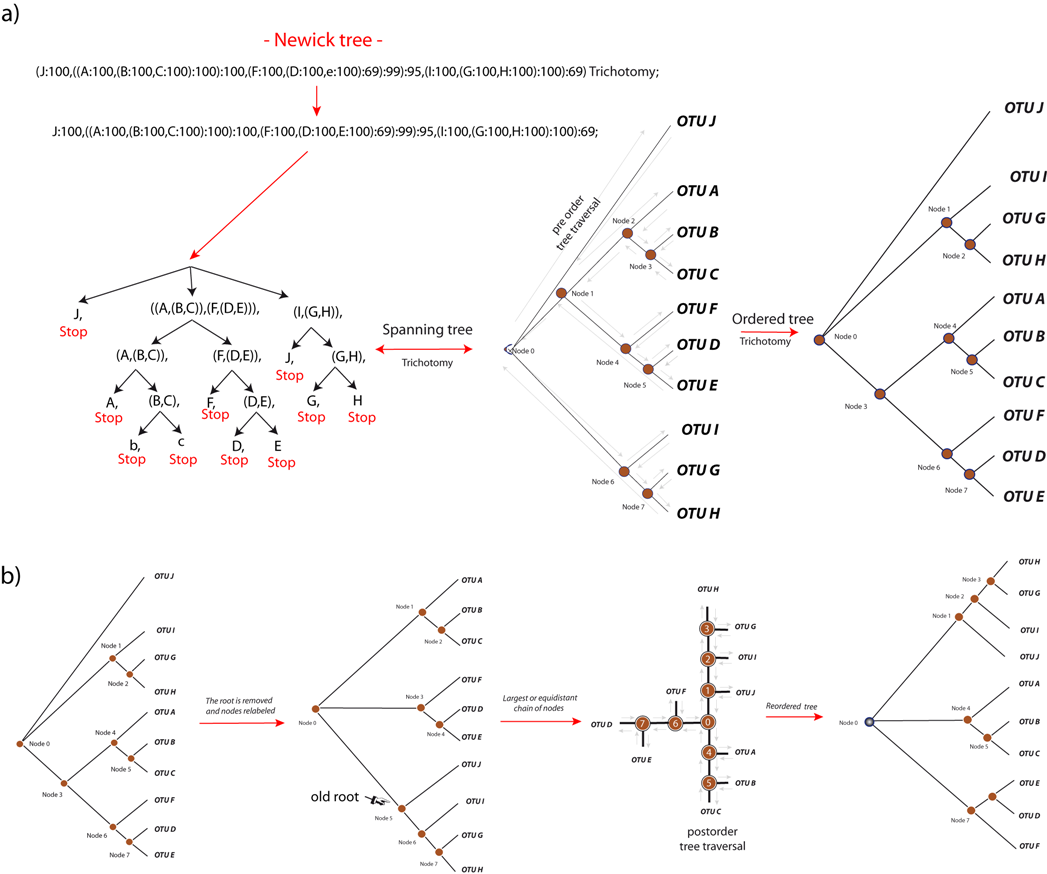
There are essentially two concepts for achieving drawings of phylogenetic trees, rooted and unrooted or radial (4). Phylograph uses three algorithms to layout the graph: A rooted tree is easy to layout by recursion (5-7) using Algorithm 1. Radial trees are layout from the combination of Algorithms 2 and 3. Algorithm 2 is a linear-time algorithm adapted with several modifications from Bachmaier et al. (8). This algorithm resolves a radial layout that Phylograph re-visits to optimize the amount of space needed by both small and big subtrees, using the "equal distant wedges" algorithm summarized in Algorithm 3. Two examples follow:
Rooted trees: As shown in Figure 2, Phylograph visits in preorder traversal a given tree T (N,E,d) and takes the first open bracket as the root (Node 0). The algorithm recursively splits the tree into subtrees and takes the root to step forward along the upper pathway of open brackets (nodes) in order to detect a name or character defined by a comma (OTU J, in the example). As the exemplified tree is thrichotomic, the algorithm steps backward looking for new commas (Nodes 1 and 2 respectively). From that point, the algorithm steps forward again looking for another character defined by a comma (OTU A). As descent is not allowed for OTUs, the next step is to read the sibling of "OTU A" that is Node 3, which is parent of "OTUs B" and "C". In the next movement, algorithm 1 steps backward to reach Node 1. From that point it visits Node 4, OTU F, Node 5, OTU D, Node 5, OTU E and repeats the process considering the subtree defined by Node 6. Finally, tree and nodes are reordered by the degree of subtrees, and the information concerning the topology is stored in a virtual list with which Phylograph allows users to depict the drawing in several formats.
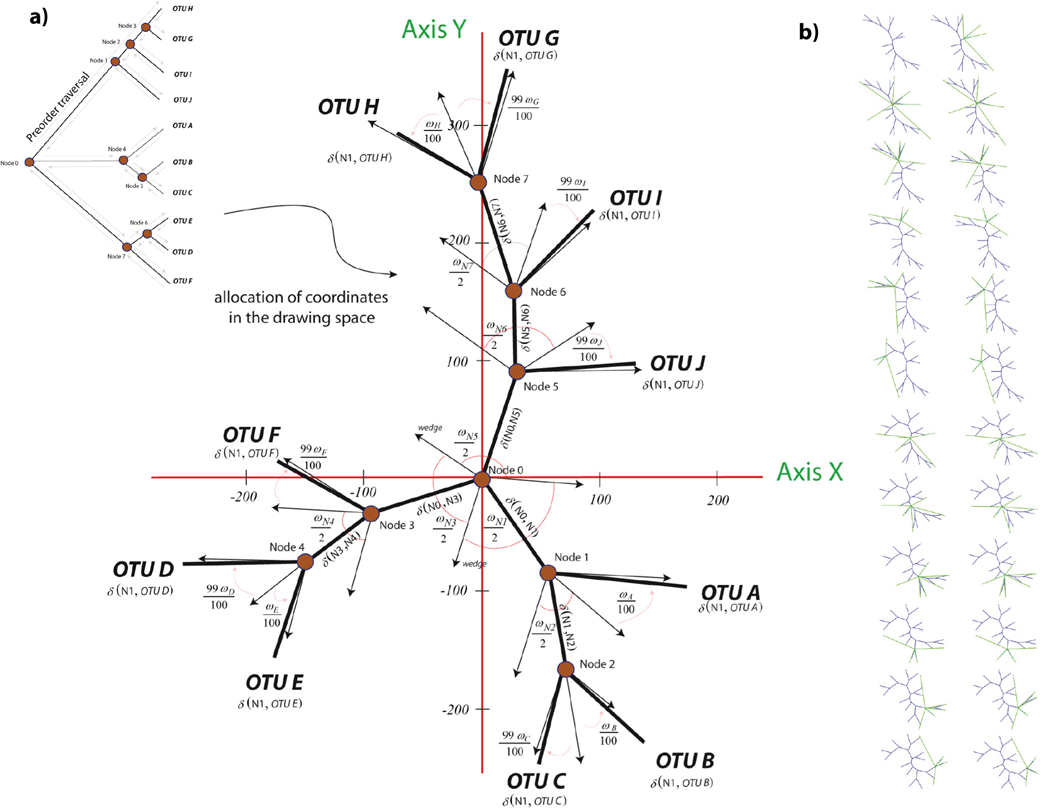
Radial trees: As shown in Figure 3a, radial trees are layout via algorithm 2, which removes the root reconsidering all subtree levels to establish a new node at level zero. Then, the program reorders subtree allocations and all vertices are assigned a wedge "ω" of angular width proportional to its number of leaves (Figure 3b). Subsequently, Algorithm 3 re-visits each node and swings the nodes and the leaves until the arcs of separation between wedges are equal in symmetry and harmonic visualization.
Empirical example
In Figure 4a, Figure 4b, Figure 4c, Figure 4d, Figure 4e, Figure 4f, Figure 4g, Figure 4h, Figure 4i and Figure 4j we summarize a number of examples of the background of functions implemented in Phylograph:
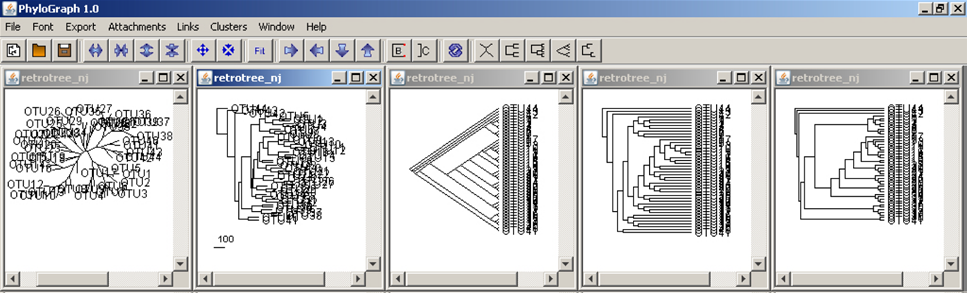
a) Phylograph allows the user to open and fit multiple trees into the workspace and display multiple layouts at the same time clicking on "Window > Tile windows". Five types of layouts - unrooted, phylogram, slanted cladogram, rectangular cladogram and phenogram -, are allowed.
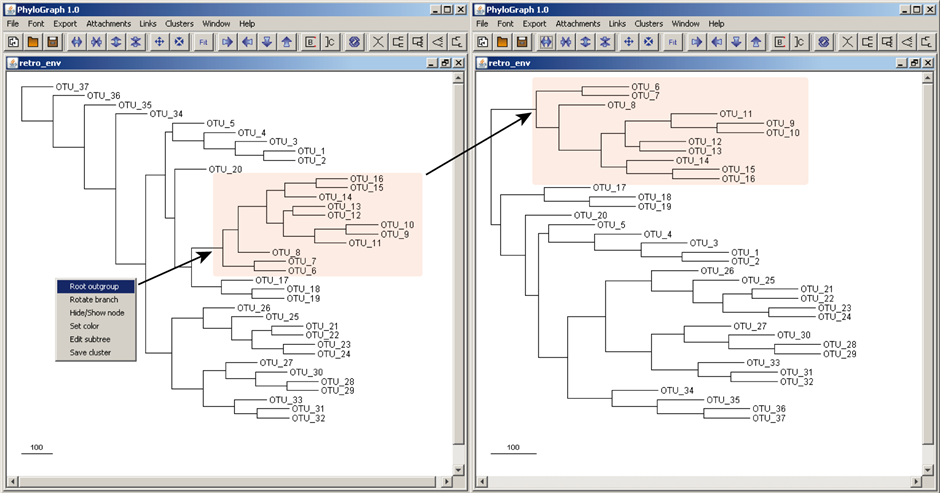
b) Trees can be rooted at any node and/or leave simply right-clicking the mouse and selecting the option "Set root" on the target node or OTU. The tree is rearranged based on the new root. The tree can be returned to its original topology right-clicking on any node or OTU and selecting "Unroot".
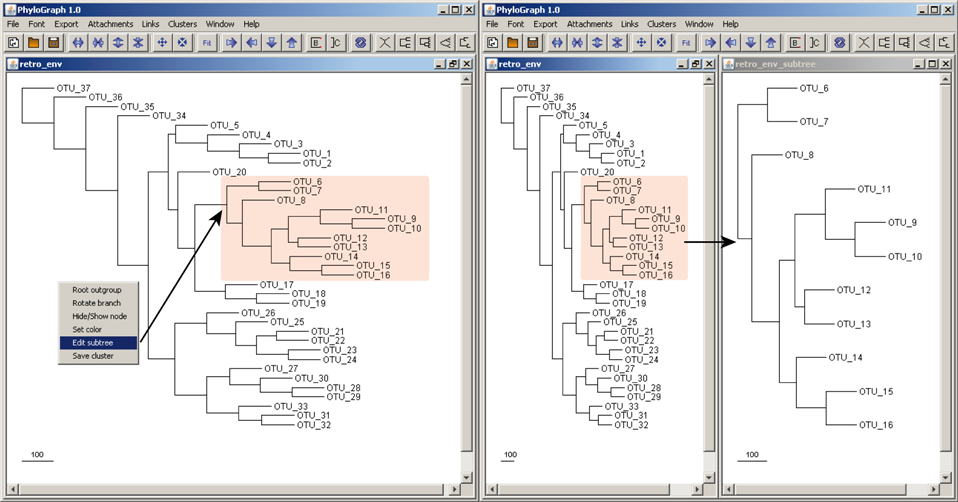
c) Phylograph also allows users to edit subtrees right-clicking in any node in the tree and selecting "Edit subtree". The new subtree is opened automatically in an individual window and can be edited separately without affecting its original parent tree.
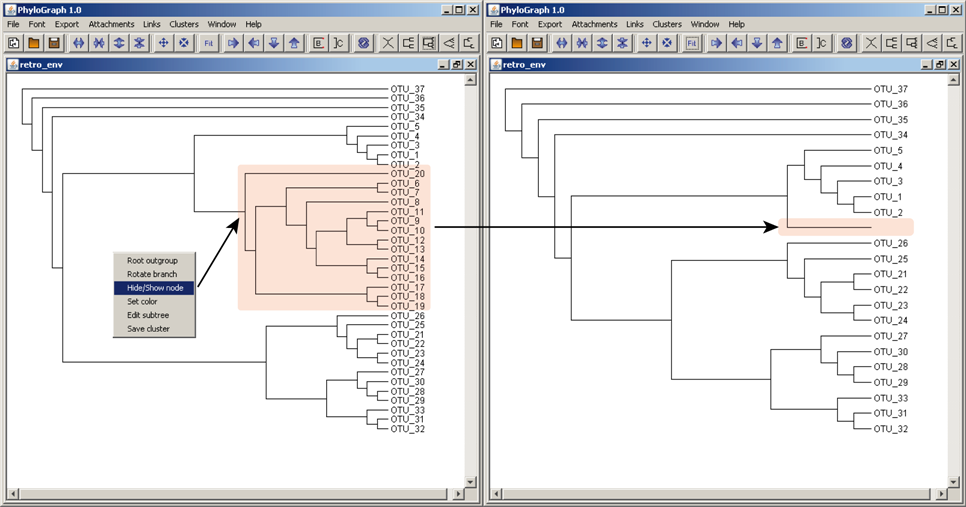
d) User can hide/show one or more nodes simply right-clicking on each node and selecting "Hide/Show node".
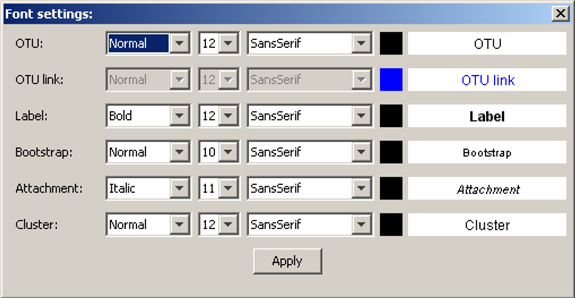
e) Font and color preferences for all components of Phylograph can be edited by clicking on "Font > Set default fonts". A graphical dialog allows users to personalize all components (OTUs, brackets, etc) globally but also, each single component can be colored right-clicking on it and selecting "Fonts & colors".
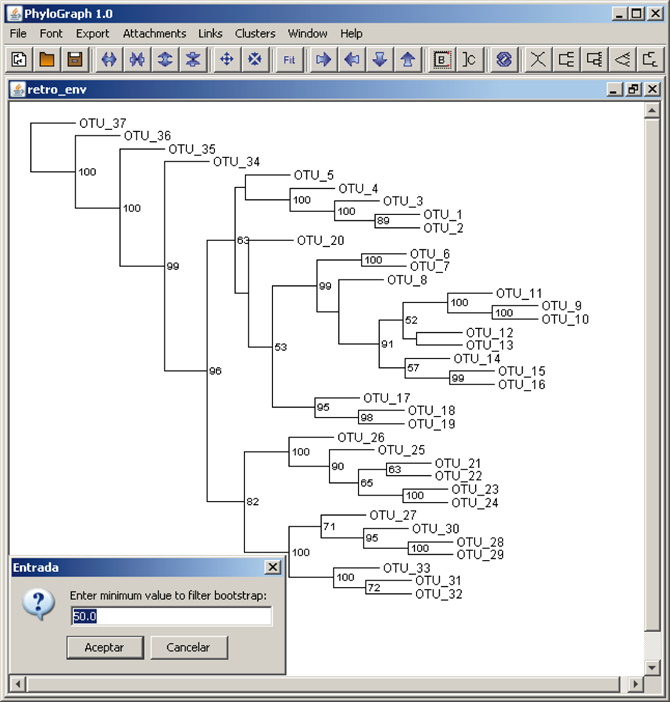
f) Phylograph shows bootstrap values and these values can be filtered to show only values greater or equal to a minimum value specified by the user.
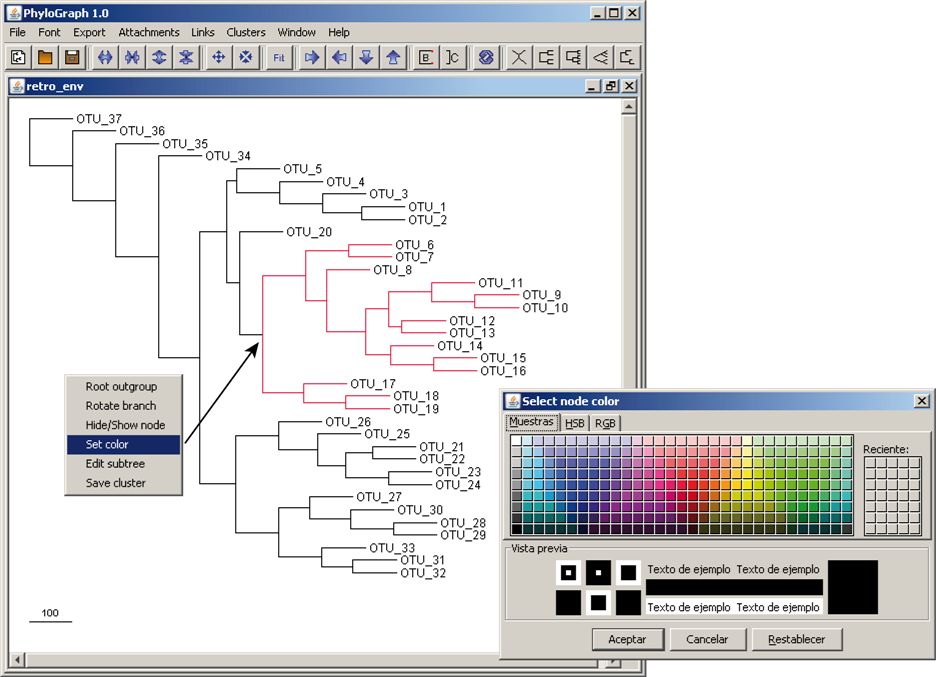
g) Branches stroke color can be modified right-clicking on a node and selecting "Set color" to highlight nodes of interest. All branches of that node are coloured recursively by default.
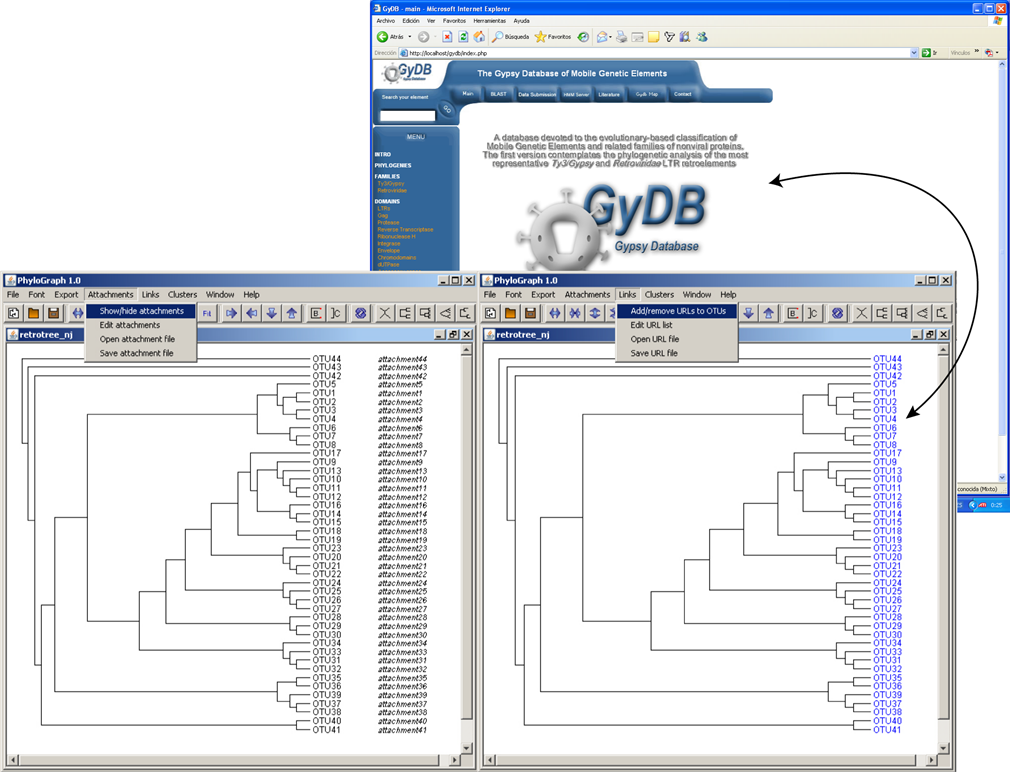
h) Two default files called "attachment_files" and "url_files" are available in the Phylograph subfolder "user_files" and can be used to save and edit specific attachments and URLs per OTU that Phylograph opens and fits in the tree in a single step. Attachments or URLs are appended to the tree clicking on "Attachment > Show/Hide attachment" or "Links > Add/Remove URLs to OTUs" respectively.
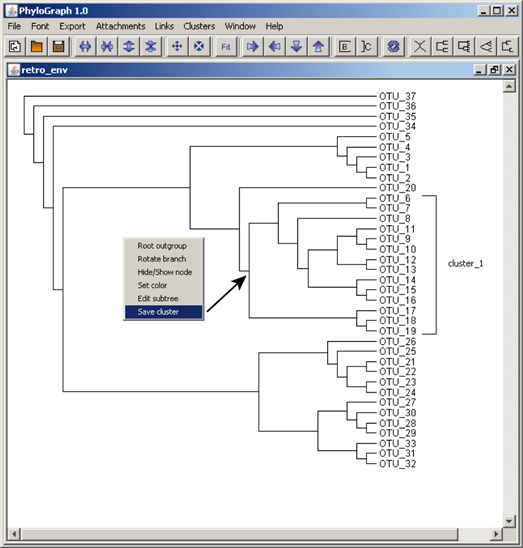
i) Users can create a cluster label and save it right-clicking on the node representative of that cluster. Selecting "Save cluster" a bracket and a label are subsequently drawn on screen. Labels can be resized holding down the "Shift" key and dragging the mouse. Each new cluster.label created can be saved automatically in a default "cluster_file" available in the Phylograph subfolder "user_files". When working with other trees based on the same clusters saved in this file, if the user selects the option "Clusters > Show/hide clusters" in the menu bar, Phylograph labels all clusters of the tree that match with the saved cluster.
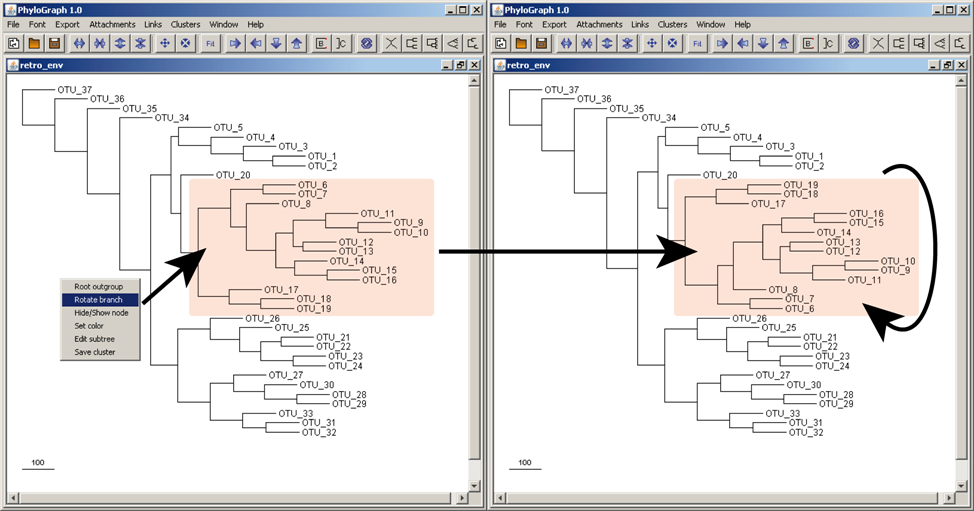
j) Right-clicking on a node and selecting "Rotate node" the tool rotate the whole branch.
Installation
Phylograph is distributed in two versions: a self-installable executable package for Microsoft Windows platforms and a zip package compatible with all platforms. Java applications do not require to be installed on the computer to run as its source code is interpreted on runtime by the Java Runtime Environment previously installed on the computer but we also provide the Windows installer which automatically creates shortcuts to the application. For executing the Windows installer version, simply double-click on the installer and follow instructions during installation. This process automatically generates desktop and start menu shortcuts. To execute the java version of the software, open a command-line interface; locate the application folder named 'phylograph'; and finally, type ?java phylo.Main?. To open a command line interface in Windows systems press the taskbar?s 'Start' button; select 'Run...'; type 'cmd.exe' and accept.
Requirements
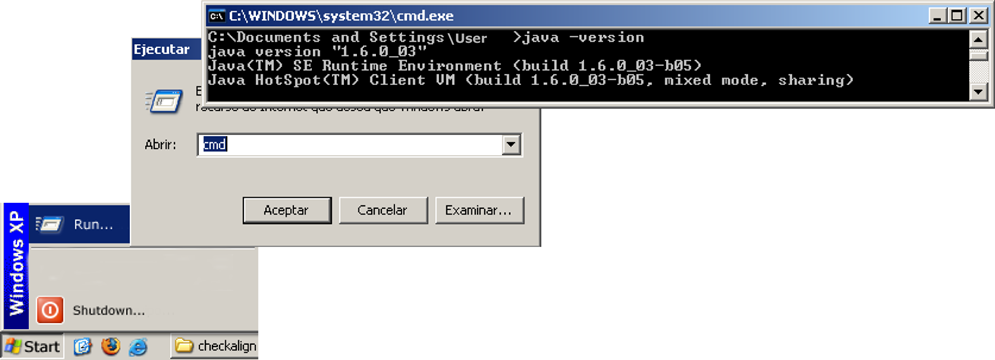
The software version is a Java application. This means that the tool runs on most PCs as a standalone program. Make sure before installing the tool that a Java Runtime Environment (JRE) is previously installed on your computer. A JRE can be downloaded and installed from Sun Microsystems' web site at URL 3. This application requires a version 6 update 2 of the JRE to run. To know if a JRE is currently installed on your system, click "Start", then select "Run", type "cmd" to open a command-line window and, finally, type "java -version" to know the current version installed on your computer. The process is show in Figure 5. If an error message is prompted, it means that a JRE is not properly installed on your computer.
Concluding Remarks
Phylograph was developed by us when dealing with the first version of the Gypsy database project (9). Applicability of this tool was inspired in other software such as TreeView (10), Drawgram/Drawtree (URL 4), and Baobab (11), etc. However, the required tree editor we were after was expected to have the capability to handle, edit, root, decorate and save graphical representation of large trees, "easy and fast". This first version of Phylograph is remarkable in these two functions, and indeed provides a plentiful background of other functions that make of Phylograph, a powerful tool in the handling of any kind of tree.
Acknowledgments
We thank Rachel Epstein for language revision and the Servei Central de Suport a la Investigaci? Experimental (SCSIE) at UVEG for technical support. Biotechvana Bioinformatics has been awarded the NOVA 2006 by IMPIVA and Conselleria d`Empresa, Universitat I C?encia of Valencia. The research has been partly supported by grants IMCBTA/2005/45, IMIDTD/2006/158 and IMIDTD/2007/33 from IMPIVA, and by grant BFU2005-00503 from MEC to AM.
Literature
- 1. Maddison, D.R., Swofford,D.L. and Maddison,W.P. (1997) Syst. Biol., 46, 590-621.
- 2. Sugiyama,K. (2002) World.Sci.Pub.Co.Pte.Ltd, Pittsburg.
- 3. Margus,T. and McMorris,F.R. (1981) Bull. Math. Biol., 43, 239-244.
- 4. Carrizo,S.F. (2004).Asia-Pacific Bioinformatics Conference (APBC 2004).
- 5. Shoenfield,J.R. (2000) A K Peters (Ed).
- 6. Causey,R.L. (2001) Jones & Bartlett (Eds.).
- 7. Cori,R., Lascar,D. and Pelletier,D. (2001) Oxford University Press.
- 8. Bachmaier,C., Brandes,U. and Schlieper,B. (2005) In Deng and D.Du : (ed.), pp. 1110-1121.
- 9. Llorens,C., Futami,R., Bezemer,D. and Moya,A. (2008) Nucleic Acids Research (NAR) 36 (Database-Issue):38-46.
- 10. Page,R.D. (1996) Comput. Appl. Biosci., 12, 357-358.
- 11. Dultier,J. and Galtier,N. (2002) Bioinformatics, 18, 292-293.
URLs
- 1. Phylograph: https://biotechvana.com/phylograph/index
- 2. Private source license: http://biotechvana.uv.es/bioinformatics/main.php?document=terms_pcl
- 3. Newick: http://evolution.gs.washington.edu/phylip/newicktree.html
- 4. Sun Microsystems: http://www.java.com
- 5. Phylip: http://evolution.gs.washington.edu/phylip.html


